


Listings from SAMHSA, November 5, 2026
How far is treatment from each Tennessee county?
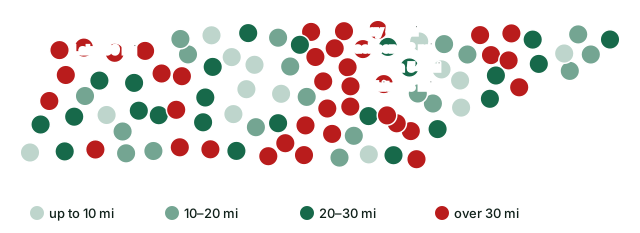
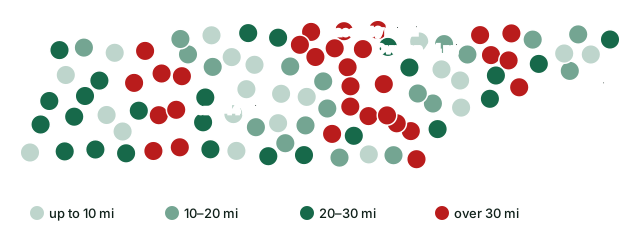
Start from the middle of each of Tennessee's 95 counties. We found how many miles it is to the closest detox, live-in program and medicine clinic. For 1,103,260 people in 38 counties, the closest detox is more than 30 miles off. 15 counties have no treatment site of their own.
Have your ZIP code and insurance card (or your loved one's) ready. This paid referral line is answered by a partner, not a listed program.
All 95 counties
Farthest from detox at the top. We count straight-line miles; by road it is farther.
| County | Population 2024 | Programs in the county | Detox, mi | Residential, mi | MAT, mi |
|---|---|---|---|---|---|
| Lake County | 6,422 | 1 | 58.9 | 20.6 | 25.3 |
| Clay County | 7,857 | 0 | 57.2 | 57.2 | 16.9 |
| Putnam County | 84,894 | 8 | 54.2 | 38.6 | 1.1 |
| White County | 29,108 | 1 | 53.0 | 35.1 | 2.2 |
| Jackson County | 12,376 | 0 | 52.2 | 42.3 | 16.6 |
| Obion County | 30,261 | 3 | 51.2 | 15.5 | 7.0 |
| Hancock County | 7,038 | 1 | 47.1 | 33.7 | 15.3 |
| Henry County | 32,883 | 1 | 45.9 | 31.8 | 41.7 |
| Cocke County | 37,596 | 1 | 45.8 | 45.8 | 16.2 |
| Lauderdale County | 24,630 | 1 | 45.2 | 22.8 | 4.9 |
| Franklin County | 45,137 | 2 | 45.0 | 29.5 | 7.7 |
| Weakley County | 33,162 | 3 | 44.4 | 8.7 | 19.4 |
| Overton County | 23,551 | 1 | 44.0 | 44.0 | 3.3 |
| Hamblen County | 67,715 | 6 | 43.4 | 39.7 | 1.8 |
| Cumberland County | 65,618 | 2 | 42.3 | 42.3 | 1.9 |
| Dyer County | 36,403 | 6 | 41.5 | 1.1 | 24.4 |
| Lincoln County | 36,751 | 1 | 41.3 | 25.7 | 1.7 |
| Benton County | 16,173 | 3 | 41.2 | 41.2 | 39.0 |
| Perry County | 8,987 | 0 | 41.2 | 44.4 | 21.0 |
| Polk County | 18,338 | 0 | 40.1 | 34.6 | 19.0 |
| McMinn County | 56,754 | 4 | 39.7 | 39.9 | 16.0 |
| Macon County | 27,189 | 1 | 39.7 | 45.9 | 13.6 |
| Moore County | 6,773 | 0 | 39.0 | 14.4 | 9.7 |
| Van Buren County | 6,686 | 0 | 38.9 | 35.6 | 16.1 |
| Warren County | 43,619 | 1 | 36.9 | 19.7 | 2.3 |
| Smith County | 20,783 | 0 | 36.6 | 30.2 | 15.7 |
| Rhea County | 34,759 | 1 | 34.6 | 40.3 | 7.2 |
| Meigs County | 13,937 | 0 | 34.3 | 37.6 | 10.4 |
| DeKalb County | 21,747 | 0 | 32.9 | 16.9 | 19.6 |
| Grainger County | 25,073 | 1 | 32.4 | 32.4 | 10.0 |
| Lawrence County | 46,467 | 5 | 32.4 | 20.2 | 3.2 |
| Humphreys County | 19,554 | 0 | 32.2 | 32.2 | 23.4 |
| Claiborne County | 33,070 | 1 | 31.7 | 31.7 | 18.8 |
| Wayne County | 15,974 | 1 | 31.5 | 44.0 | 23.4 |
| Pickett County | 5,108 | 0 | 31.3 | 31.3 | 18.0 |
| Coffee County | 61,285 | 4 | 30.9 | 19.7 | 1.2 |
| Grundy County | 14,148 | 1 | 30.6 | 32.0 | 9.5 |
| Hardeman County | 25,434 | 3 | 30.2 | 23.8 | 21.3 |
| Hawkins County | 59,371 | 2 | 30.0 | 17.1 | 3.3 |
| Bledsoe County | 15,591 | 0 | 29.8 | 37.0 | 13.0 |
| Carroll County | 29,107 | 2 | 29.6 | 31.2 | 28.5 |
| Decatur County | 11,800 | 1 | 29.6 | 36.5 | 27.0 |
| Jefferson County | 59,217 | 6 | 29.5 | 29.5 | 2.7 |
| Tipton County | 62,187 | 4 | 28.7 | 27.6 | 4.6 |
| Johnson County | 18,506 | 2 | 27.9 | 22.8 | 20.2 |
| Giles County | 30,971 | 2 | 27.6 | 3.3 | 3.3 |
| Greene County | 73,398 | 2 | 27.3 | 23.5 | 0.9 |
| Trousdale County | 12,159 | 1 | 27.3 | 32.7 | 0.6 |
| Hickman County | 25,859 | 0 | 26.6 | 25.7 | 15.1 |
| Fayette County | 44,476 | 2 | 25.7 | 21.7 | 4.4 |
| Haywood County | 17,097 | 2 | 25.5 | 25.5 | 17.9 |
| Fentress County | 20,129 | 2 | 25.2 | 25.2 | 21.1 |
| Lewis County | 13,418 | 1 | 25.0 | 23.8 | 2.1 |
| Henderson County | 28,183 | 2 | 24.9 | 22.8 | 22.8 |
| Sevier County | 100,184 | 7 | 24.4 | 24.4 | 13.7 |
| Monroe County | 49,154 | 1 | 24.1 | 26.8 | 7.9 |
| Bedford County | 54,228 | 5 | 23.7 | 2.4 | 3.5 |
| Morgan County | 21,954 | 2 | 23.5 | 23.5 | 16.9 |
| Gibson County | 51,422 | 5 | 23.2 | 24.1 | 21.2 |
| Robertson County | 78,459 | 2 | 23.0 | 23.0 | 18.5 |
| Bradley County | 113,782 | 7 | 21.9 | 18.1 | 1.2 |
| Dickson County | 57,641 | 2 | 21.4 | 15.7 | 5.1 |
| Roane County | 56,742 | 4 | 20.0 | 20.0 | 6.4 |
| Crockett County | 13,973 | 0 | 19.9 | 21.0 | 18.5 |
| Cannon County | 15,142 | 1 | 19.1 | 1.8 | 19.1 |
| Marshall County | 37,847 | 1 | 19.1 | 18.9 | 19.1 |
| Sumner County | 211,721 | 5 | 19.0 | 27.0 | 5.7 |
| Chester County | 17,876 | 1 | 18.4 | 9.6 | 9.6 |
| Stewart County | 14,365 | 0 | 18.1 | 18.1 | 18.1 |
| Loudon County | 62,129 | 1 | 17.8 | 18.8 | 15.2 |
| Marion County | 29,826 | 5 | 17.3 | 16.9 | 5.3 |
| Sequatchie County | 17,620 | 1 | 17.1 | 22.0 | 17.1 |
| Wilson County | 169,948 | 2 | 16.4 | 16.4 | 5.3 |
| Houston County | 8,538 | 1 | 16.1 | 16.1 | 16.1 |
| Campbell County | 40,238 | 4 | 15.2 | 15.2 | 4.8 |
| Union County | 21,064 | 1 | 15.1 | 15.1 | 3.2 |
| Unicoi County | 17,872 | 1 | 14.8 | 14.8 | 14.8 |
| Carter County | 57,434 | 3 | 12.2 | 8.1 | 6.6 |
| Sullivan County | 162,703 | 12 | 11.7 | 11.7 | 7.2 |
| McNairy County | 26,103 | 3 | 11.3 | 24.9 | 1.4 |
| Hardin County | 27,617 | 5 | 11.1 | 37.9 | 3.2 |
| Cheatham County | 42,604 | 1 | 8.4 | 8.4 | 8.4 |
| Shelby County | 910,530 | 29 | 7.6 | 4.9 | 5.2 |
| Montgomery County | 246,025 | 7 | 7.3 | 7.3 | 6.5 |
| Anderson County | 81,449 | 7 | 6.8 | 6.8 | 3.6 |
| Washington County | 139,642 | 13 | 6.3 | 6.9 | 6.3 |
| Williamson County | 269,136 | 14 | 6.0 | 4.8 | 1.6 |
| Scott County | 22,517 | 3 | 5.2 | 5.2 | 5.2 |
| Blount County | 142,211 | 8 | 5.1 | 5.4 | 5.1 |
| Knox County | 506,748 | 23 | 4.0 | 4.1 | 1.4 |
| Hamilton County | 386,256 | 17 | 2.6 | 8.9 | 2.6 |
| Madison County | 100,409 | 15 | 2.1 | 1.2 | 1.2 |
| Maury County | 113,411 | 7 | 1.3 | 1.2 | 1.2 |
| Davidson County | 729,505 | 33 | 1.2 | 1.2 | 1.2 |
| Rutherford County | 376,996 | 11 | 1.2 | 6.2 | 1.2 |
Where to begin?
Still choosing a program? Contact any listed program yourself, or call the referral line below.
This paid referral line is answered by a partner, not a listed program.
Method
Facilities come from SAMHSA FindTreatment.gov: each Tennessee listing with substance use treatment or detox (snapshot of November 5, 2026). County centers are from the U.S. Census Bureau 2024 Gazetteer. Population is from Census 2024 estimates. Each facility goes to a county by its ZIP code, using the Census ZCTA-to-county file. We measure great-circle miles between the county's internal point and the coordinates listed for the facility; when SAMHSA gives no coordinates, the Census Geocoder places the listing by its address, or at its ZIP code center if no street is given. We count certified opioid treatment programs (OTP) as MAT. You may reuse the data if you link to this page.